
Fig. 2.
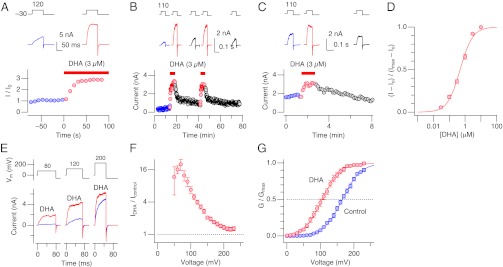
Characteristics of the DHA action in the absence of Ca2+ on Slo1+β1 channels expressed in HEK cells. (A) DHA rapidly increases currents through Slo1+β1 channels when applied to the cytoplasmic side. Currents at 120 mV were normalized to the average current size before DHA application and the peak outward current sizes are shown. Two representative currents are also shown (Top). (B) Current-enhancing effect of DHA applied to the intracellular side is reversible. Peak outward current sizes at 110 mV are plotted. Representative currents are also shown (Top). (C) DHA applied to the extracellular side in the outside-out configuration also increases currents through Slo1+β1 channels. (D) Concentration dependence. Currents were measured at 120 mV and every concentration of DHA shown was tested in each patch. n = 16. At 120 mV, DHA (3 µM) increases G/Gmax from ∼0.2 to ∼0.7 (Fig. 2G). The curve represents a Hill fit with EC50 = 486 ± 127 nM and the coefficient = 1.10 ± 0.28. (E) Representative currents through Slo1+β1 channels before and after application of DHA at three different voltages. (F) Fractional increases in current size at different voltages. n = 10. (G) Voltage dependence of normalized conductance (G/Gmax). Curves represent Boltzmann fits with V0.5 = 165.6 ± 0.9 mV and Qapp = 0.90 ± 0.03 (control) and 105.37 ± 1.0 mV and 0.96 ± 0.03 (DHA). n = 10. Except in D, DHA was applied at 3 µM. All results were obtained without Ca2+.