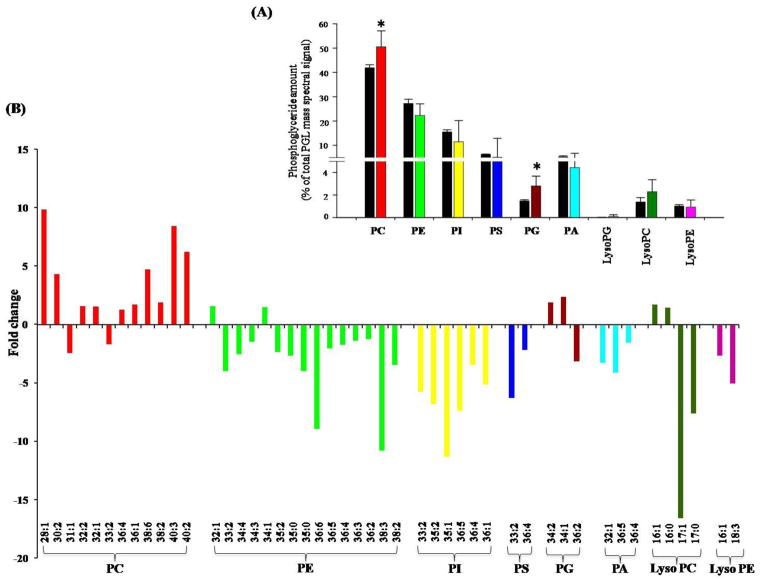
Figure 2. Effect of CUR on PGLs.
(A) Shows the mole percentage composition of PGL classes.
(B) Depicts fold changes in molecular lipid species composition of PGLs. Only the molecular lipid species that were statistically significant (with p-value <0.05) are included in this figure. The entire data set is shown in the Supplementary Table S1.

