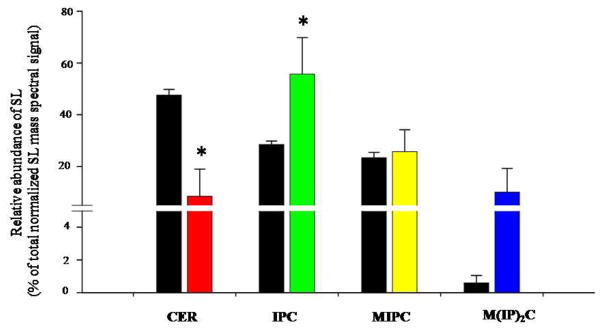
Figure 3. Effect of CUR on SLs composition.

Figure shows the relative abundance of SL groups as mole percentage of the normalized total SL mass spectral signal. The total for each SL class was calculated by adding the mole percentage of the molecular lipid species of that class. The entire data set is shown in the supplementary table (Table S1). Values are means ± SD (n = 3). Statistically significant (p-value <0.05) differences are marked by an asterisk (*). The black bars represent the untreated cells and the colored bars are the CUR treated cells.
