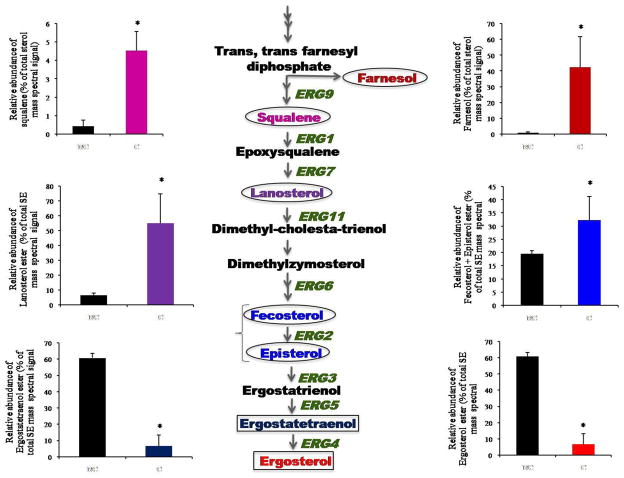
Figure 4. Effect of CUR on sterol composition.
Flow diagram depicts part of sterol biosynthetic pathway highlighting responsive genes and their products in CUR treated Candida cells. The accumulated intermediates are highlighted by circles and the depleted products are highlighted by rectangles. Squalene and farnesol were determined by GCMS analyses while other sterols depicted were determined as sterol esters using ESI-MS/MS, as described in methods. Error bars indicate ± SD. (n = 3). Statistically significant (p-value <0.05) differences are marked by an asterisk (*). The levels of all the sterol intermediates responsive to CUR treatment are plotted as histograms with matching color coding with the intermediates of the pathway. The black bars represent the untreated cells. See supplementary table S1 for details.

