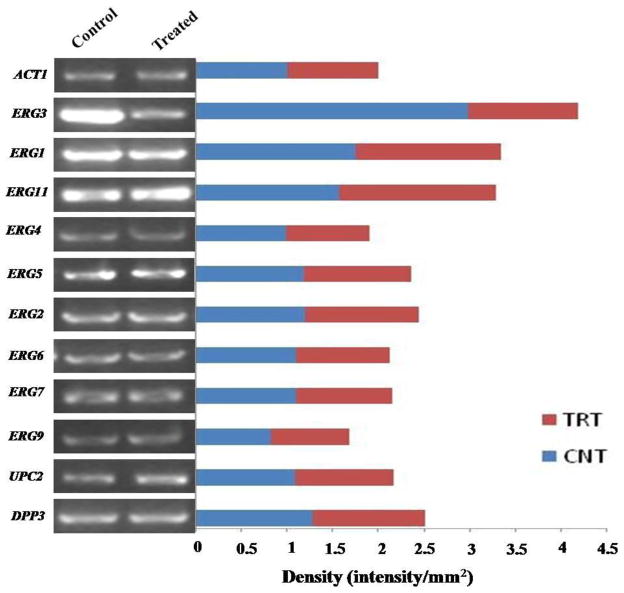
Figure 6. Effect of CUR on the expression of ERG genes as determined by RT-PCR.
Transcript levels of genes associated with ergosterol and sphinolipid metabolism in control and treated samples following CUR treatment in C. albicans isolate SC5314, as described in the Methods. Following electrophoresis through 1.2% agarose gel, the amplified PCR products were visualized by staining with ethidium bromide and quantified using the software Image J as represented by horizontal bars. ACT1 mRNA levels were used as a loading control.

