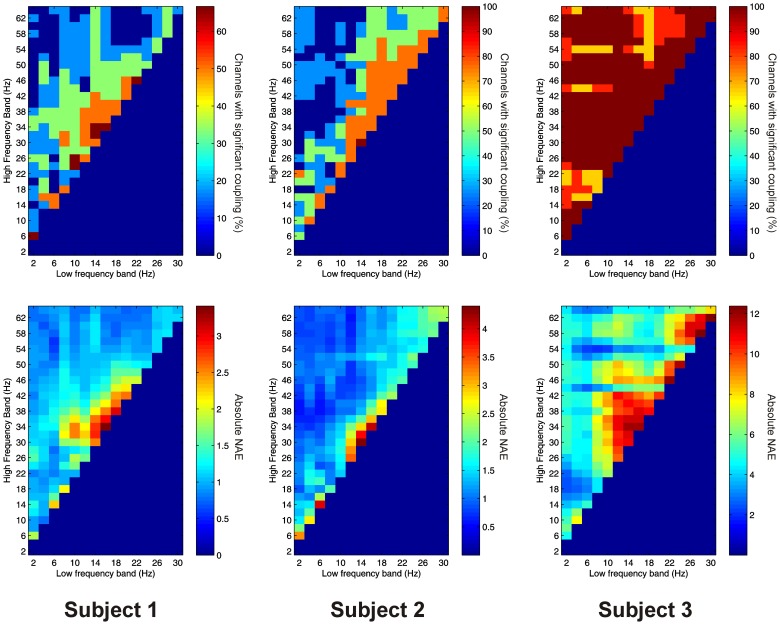
Figure 3.
Top row: Proportion of channels showing significant local AAC in the thalamus (Subject 1 left, Subject 2 middle, Subject 3 right). Bottom row: Mean strength of AAC (assessed by the absolute value of the normalized amplitude envelope correlation) in the thalamus (Subject 1 left, Subject 2 middle, Subject 3 right).

