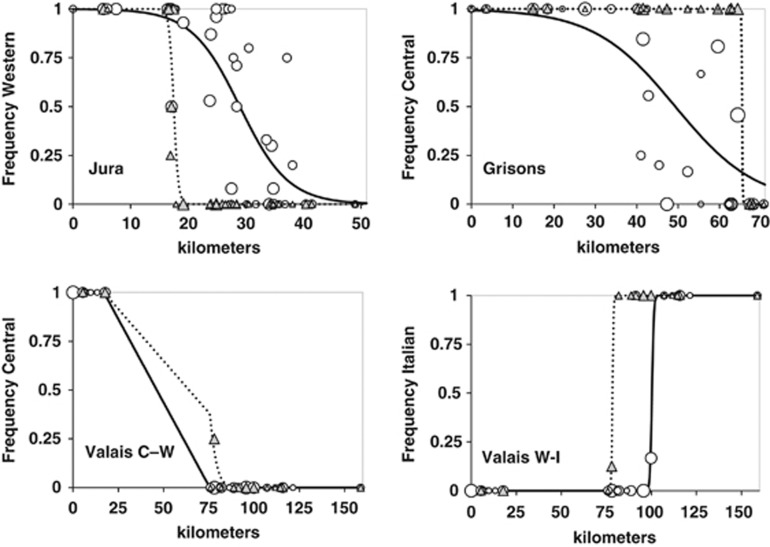
Figure 2.
Plots of lineage frequencies in populations versus position (km) along the transects Jura, Grisons and Valais for mtDNA (white circles) and Y-chromosomal (grey triangles) markers. Sizes of symbols are proportional to the log number of samples. Bold lines are fitted clines for mtDNA and dashed lines for Y-chromosomal markers. Despite a sampling gap in the Valais transect, an admixed population was detected at km 78, pointing to at least partial contact between the Western and the Central lineage in this transect. See Table 2 for cline properties and statistical comparisons.

