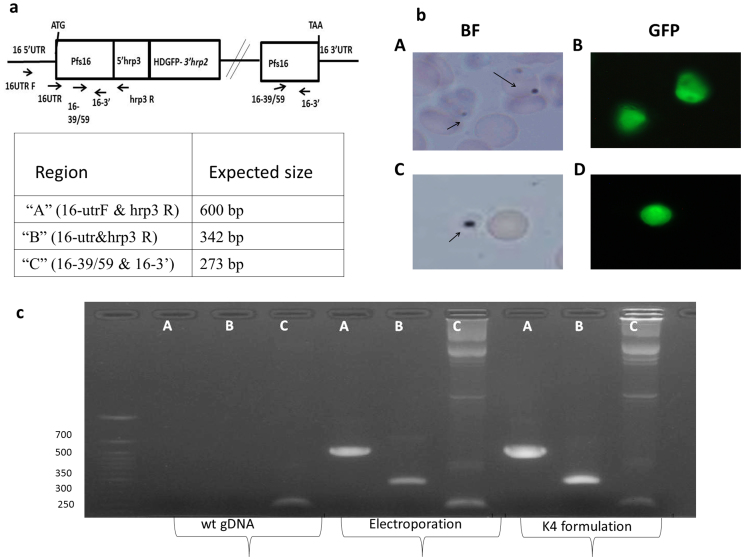
Figure 2. GFP expression and PCR analysis from P. falciparum- infected erythrocytes by electroporation (EP) and K4 formulation methods.
(a) Schematic representation of genomic organization of a disrupted Pfs16 locus. Arrows indicate the location and orientation of various primers used in PCR analyses. Table below indicates the expected size of the various PCR products. (b) K4 (panels A and B) and EP (panels C and D) and parasites transfected with p16FAGFP showing expression of GFP when viewed under fluorescence microscope using 100× magnifications. Bright field (BF) image of the same is shown on the left for each image. The percentage of GFP positive parasites in the K4 group was 75% (range 64 to 86%) as compared to 60% (range 59 to 61%) in the EP group (c) PCR genotype analysis using primer pair A, B and C for wild type and transfected parasites. Numbers on left indicate molecular weight standards (size in base pairs).

