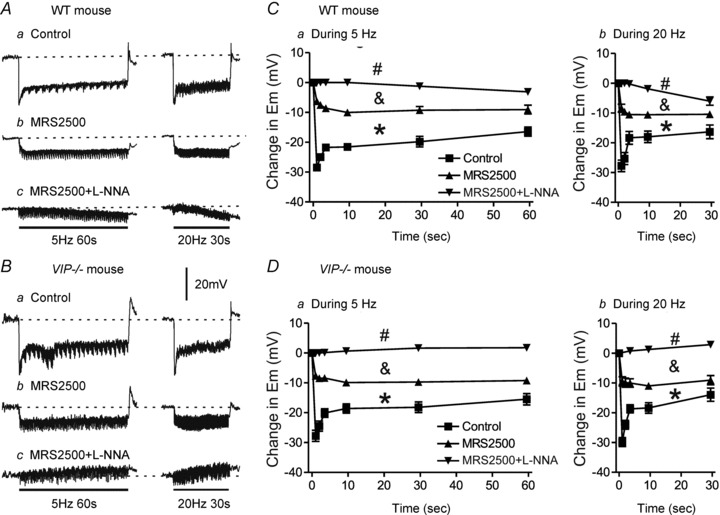
Figure 8. An NNNP hyperpolarization develops during EFS with longer stimulus trains in WT but not VIP−/− mice.

A and B, sample traces showing IJPs elicited with 5 Hz EFS for 60 s (left traces) or 20 Hz EFS for 30 s (right traces) in WT (A) and VIP−/− mice (B). Inhibitory junction potentials were reduced by MRS2500 (1 μm) in WT (Ab) and VIP−/− mice (Bb), while a small hyperpolarization developed in WT mice (Ac) and a small depolarization developed in VIP−/− mice (Bc) following combined addition of MRS2500 and l-NNA (100 μm). C and D, summary graphs of IJP amplitude with time during 5 Hz (n = 4–6) or 20 Hz EFS (n = 4–5) in WT mice (C) and 5 Hz (n = 7–10) and 20 Hz (n = 7–10) EFS in VIP−/− mice (D). Control IJPs in WT and VIP−/− mice were not significantly different. Inhibitory junction potentials were significantly reduced (*p<0.05) by MRS2500 alone in both WT and VIP−/− mice, but remaining IJPs were still not different from one another. Combined MRS2500 plus l-NNA further reduced (& p<0.05) IJPs in both WT and VIP−/− mice, but in this case the remaining electrical events in WT mice were significantly different from those in VIP−/− mice (#p<0.05). One-way ANOVA with Tukey's post hoc test. Shown are mean values ± SEM.
