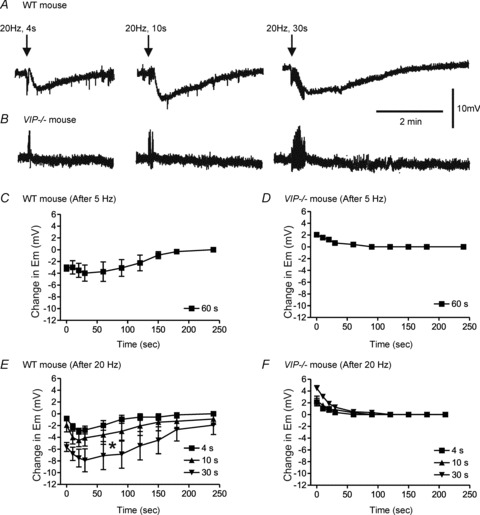
Figure 9. Non-nitrergic, non-purinergic (NNNP) relaxation post-stimulus hyperpolarization develops following longer stimulus trains in WT but not VIP−/− mice.

A and B, sample traces showing an NNNP post-stimulus hyperpolarization following 20 Hz EFS in the WT (A) but not VIP−/− mice (B). C–F, summary graphs of the changes in membrane potential (Em) following stimulus trains of various lengths at 5 Hz (C, n = 4; D, n = 5) or 20 Hz (E, n = 5; F, n = 6) in WT (C and E) and VIP−/− mice (D and F). Post-stimulus hyperpolarization developed following EFS in WT mice. At 20 Hz EFS, the amount of hyperpolarization significantly (*p<0.05) increased with longer stimulus trains (E). Post-stimulus hyperpolarization was absent in VIP−/− mice. Rather, Em repolarized towards baseline for 10–30 s following EFS (D and F). One-way ANOVA with Tukey's post hoc test. Shown are mean values ± SEM.
