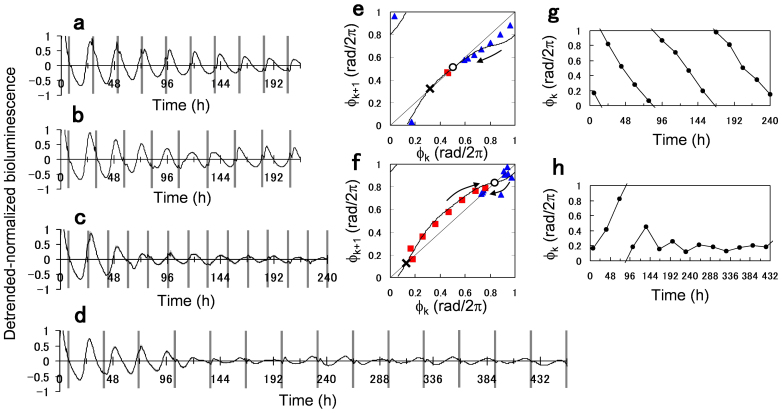
Figure 5. Entrainment to periodically applied 2-h dark pulses.
(a–d) Bioluminescence signals of the CCA1::LUC plant perturbed by 2-h dark pulses with a period of (a) T = 22 h, (b) T = 25 h, (c) T = 18 h, and (d) T = 32 h. Each panel represents the averaged signal over n = 30, 22, 20 and 9 plants, respectively. Gray bars indicate timing of 2-h dark pulses. (e, f) Return maps of phase Φk observed at the kth dark pulse under T = 22 h (e) and 25 h (f). The points were obtained from (a) and (b). The red squares and blue triangles indicate transient processes to approach the stable fixed point with increasing and decreasing direction of Φk, respectively. The solid lines indicate Φk+1 = Φk + G(Φk) + 2π(T − τ)/τ mod 2π with a natural period of τ = 23 h. The open circle and cross represent stable and unstable fixed points, respectively, obtained as solutions of G(Φ) + 2π(T − τ)/τ = 0. (g, h) Time series of the phase Φk under (g) T = 18 h and (h) T = 32. The points were obtained from (c) and (d).

