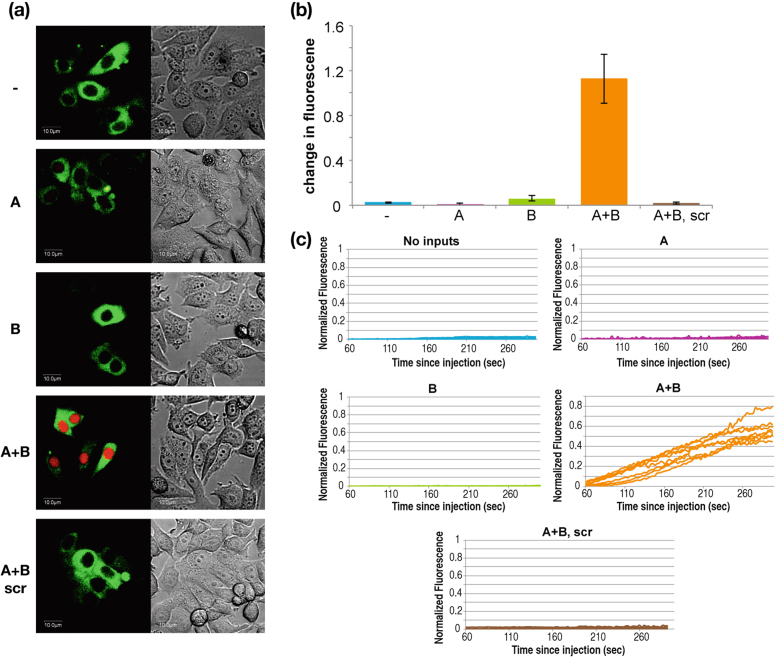
Figure 4. DNAzyme-based AND gate operating within cancerous living cells.
Left panel, fluorescent view of the injected cells; Right panel, phase view of the cells during and after injection. For each inputs combination 15 cells were microinjected with the following mixtures: (1) AND gate components; (2) combination of miRNA inputs (A = miR21, B = mir125b), (3) a fluorescent-quenched substrate (red) and (4) green Dextran (70 KDa), which was used to normalize and mark injected cells. (a) Representative injected cells were imaged for 5 minutes after injection. Only when both inputs were present (A + B), the red substrate was cleaved and therefore visible. ‘scr’ represent injections of a scrambled DNAzyme's component sequence, which were otherwise identical to the normal injections; (b) Average of relative change in red fluorescence in 15 cells, 5 minutes after microinjection (change was calculated as: normalized fluorescence 5 minutes post injection minus normalized fluorescence 1 minute post injection). The design of the AND gate is as shown in Fig. 1. Standard deviation errors are shown (bars). (c) Kinetic results in living cells.

