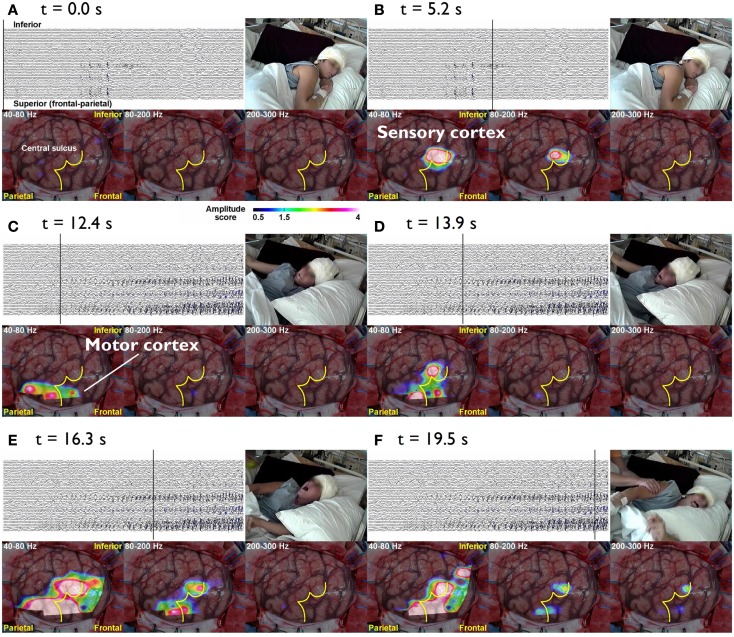
Figure 1.
The cursor on the EEG indicates the time of the video and topographies. The color bar at the bottom indicates the amplitude score, where scores ≥1.5 are considered to be a significant increase from the inter-ictal period. (A) t = 0.0 s The patient lies still on the bed without symptoms. (B) t = 5.3 s During the diffuse EEG attenuation period, the patient complains of abnormal sensation in the left hand. There is an increase in the amplitude in 80–200 and 200–300 Hz bands over the sensory cortex of the left hand. (C) t = 15.5 s After 40–80 and 80–200 Hz activities start building up in the EEG, they gradually spread anteriorly toward the motor cortex of the left hand and tonic flexion of the left arm is seen. (D) t = 23.6 s Subsequently, the activities within all three bands (40–300 Hz) gradually increase in amplitude and spread to adjacent areas. Activities at 40–80 and 80–200 Hz also spread to the inferior rolandic region. However, even when the seizure becomes secondarily generalized, the HFOs are confined to the rolandic region (E,F) (Akiyama et al., 2011).

