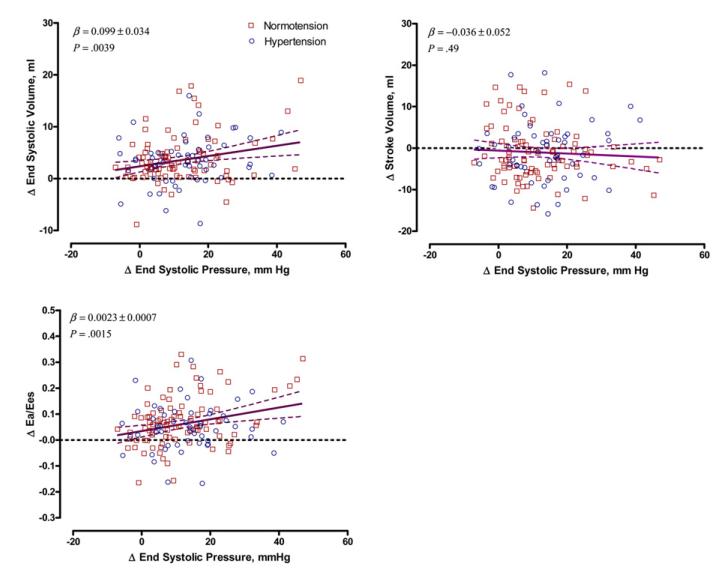
Figure 2.
Scatterplots of the changes in LV ESV, SV, and Ea/Ees ratio versus changes in ESP during handgrip exercise in multivariate-adjusted analyses of 148 participants, including 90 subjects with normal BP (squares) and 58 patients with hypertension (circles). The solid and dotted lines represent the regression line and the 95% CI, respectively. The regression slopes were standardized to the means of the distributions of sex, values at rest, and age.

