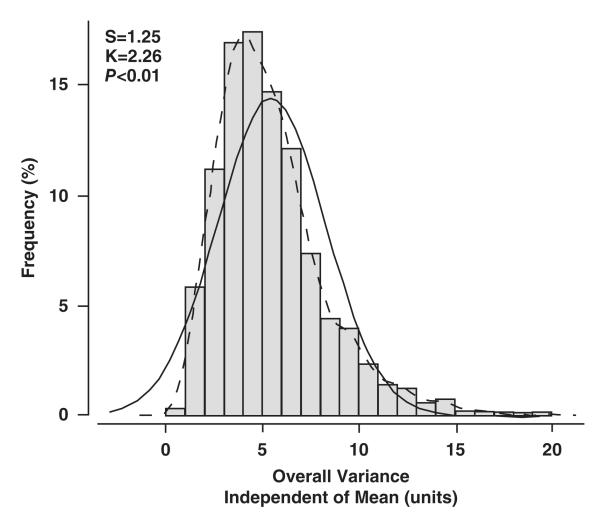
Figure 2.
Frequency distribution of overall variability of systolic blood pressure independent of the mean. Overall variability is based on 10 blood pressure readings in 2944 participants, that is, 5 at each of 2 home visits. The P value is for departure of the actually observed distribution (full line) from normality (dotted line). S indicates the coefficient of skewness; K, the coefficient of kurtosis.

