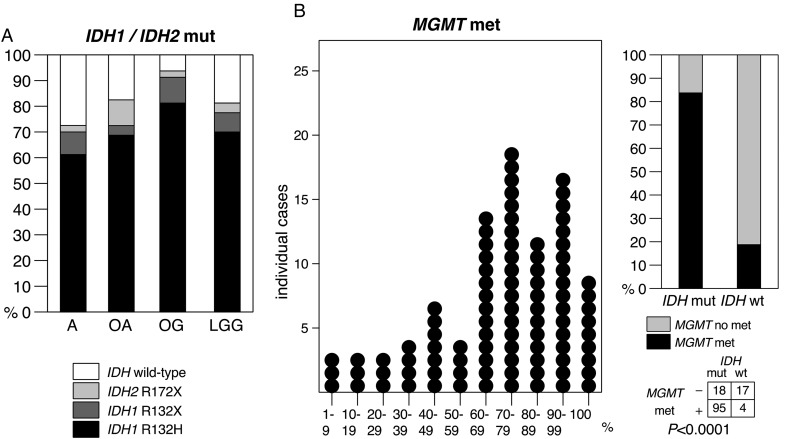
Fig. 1.
Distribution of biomarkers in the studied population with LGG. (A) Frequencies of IDH1 and IDH2 mutations by tumor histology; (B) distribution plot of percentages of methylated MGMT promoter in individual IDH-mutant LGG (left), association between IDH mutation (IDH1 or IDH2), and MGMT promoter methylation (right).

