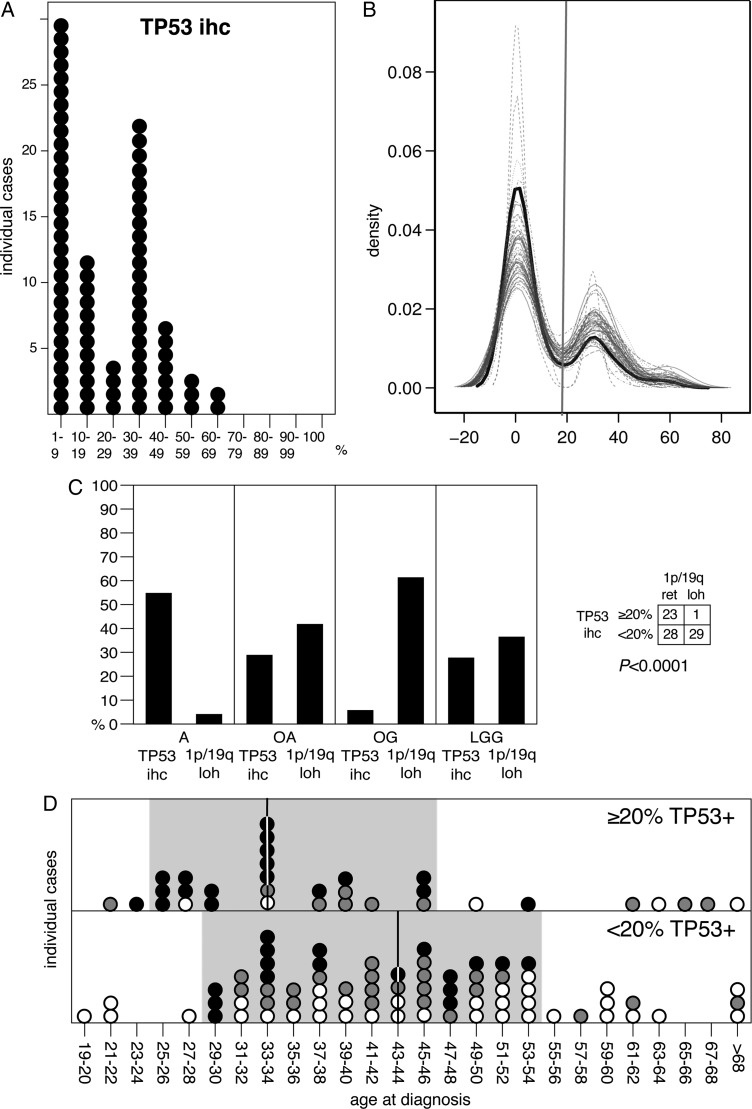
Fig. 3.
TP53 data. (A) distribution plot of percentages of TP53 immunopositivity in individuals with LGG; (B) kernel density estimates for the marginal distributions of the observed data (black line) and the m = 50 densities from the imputed data (gray lines), only numeric imputed variables are shown; (C) frequencies of 1p/19q loss and TP53 immunopositivity (cutoff: ≥20%) in IDH-mutant tumors by histology (left) and tested association between TP53 immunopositivity and 1p/19q loss (right); (D) distribution plot of age at diagnosis for IDH-mutant LGG depending on TP53 immunopositivity (≥20%). Vertical bars indicate median value and grey background highlights sample clustering. Filled circles: A, grey circles: OA, open circles: OG.

