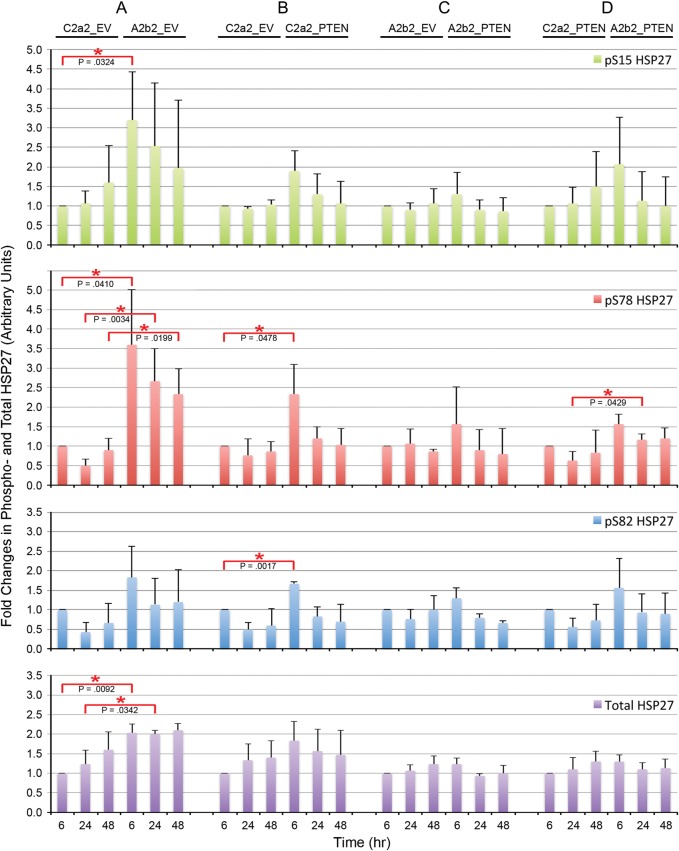
Fig. 3.
Quantitation of SPARC-, PTEN-, and SPARC and PTEN–induced effects on HSP27 phosphorylation and expression over time. Average fold changes in phosphorylation-specific or total HSP27 due to SPARC (A) PTEN (B), PTEN in the presence of SPARC (C), and SPARC in the presence of PTEN (D) were measured. Error bars denote 1 standard deviation. Red asterisks indicate significant differences between clones at matched time points. Average data for n = 3 for phosphorylation-specific experiments and n = 9 for total HSP27.

