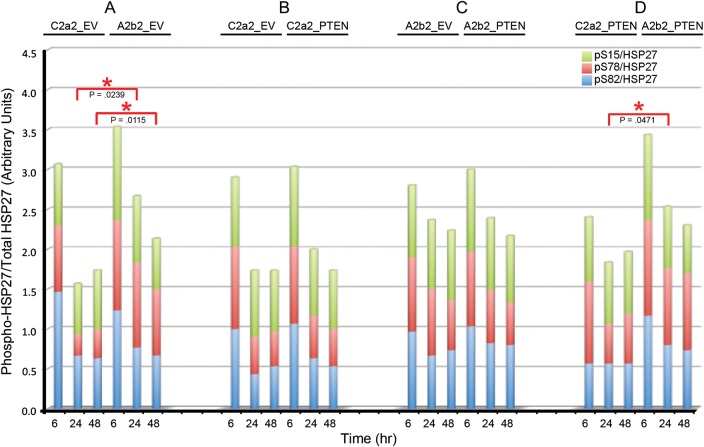
Fig. 5.
SPARC and PTEN effects on the levels of pHSP27 (Ser15 [green], Ser78 [red], Ser82 [blue]) relative to total HSP27. Stacked fold changes in phosphorylation-specific relative to total HSP27 due to SPARC (A), PTEN (B), PTEN in the presence of SPARC (C), and SPARC in the presence of PTEN (D) were measured. Red asterisks indicate significant differences between time points for Ser78. No significant differences were detected for Ser15 and Ser82. Average ratios for 3 experiments.

