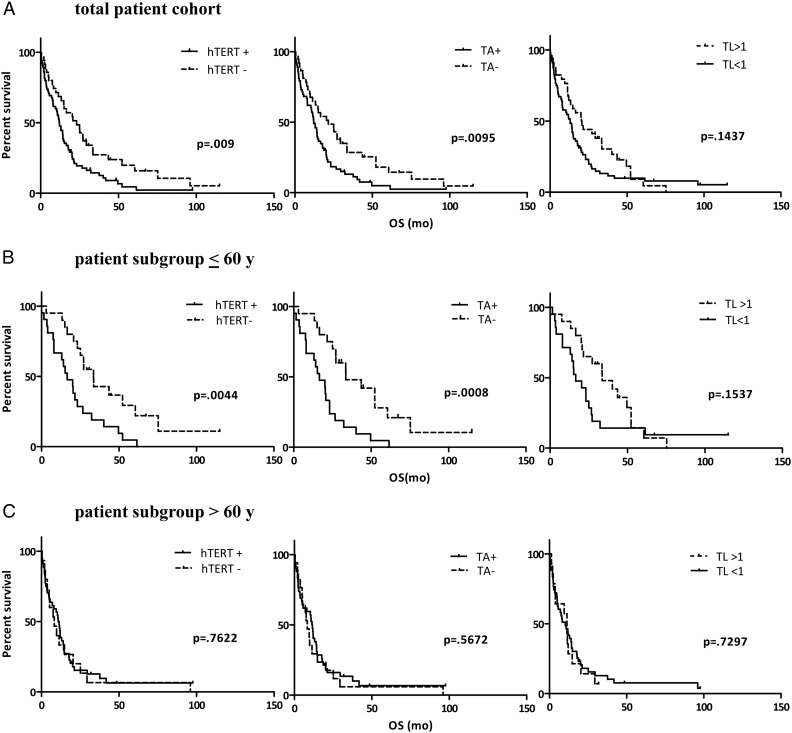
Fig. 2.
Telomerase-associated parameters compared with overall survival. Kaplan–Meier survival curves for patient subgroups according to the indicated telomerase-associated parameters (hTERT expression, TA, and telomere length [TL]) are shown for the whole GBM patient cohort (n = 100) (A), in the patient subgroup aged ≤60 y (n = 41) (B, upper panel), and in the subgroup of patients aged >60 y (n = 59) (B, lower panel). Abbreviation: OS, overall survival.

