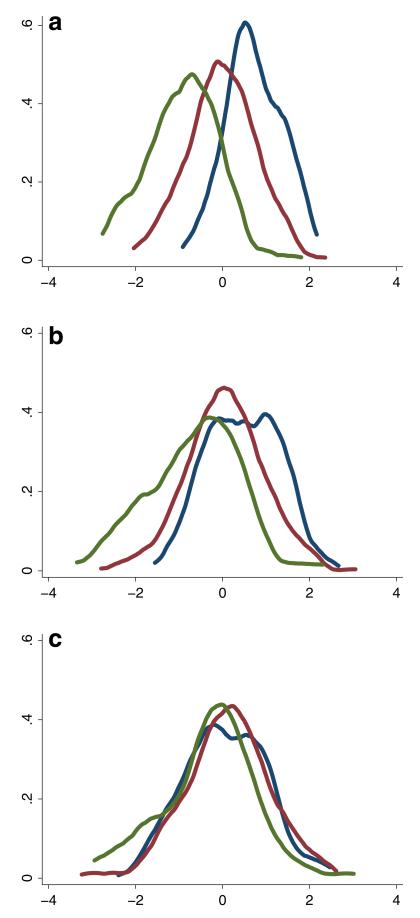
Fig. 1.
Kernel density plots* of a executive functioning, b residual for executive functioning when adjusting for demographics, Hachinski score and brain imaging parameters and c residual for executive functioning when adjusting for memory, demographics, Hachinski score and brain imaging parameters * Blue curves represent scores for people with normal cognition, red represents people with MCI, and green represents people with AD

