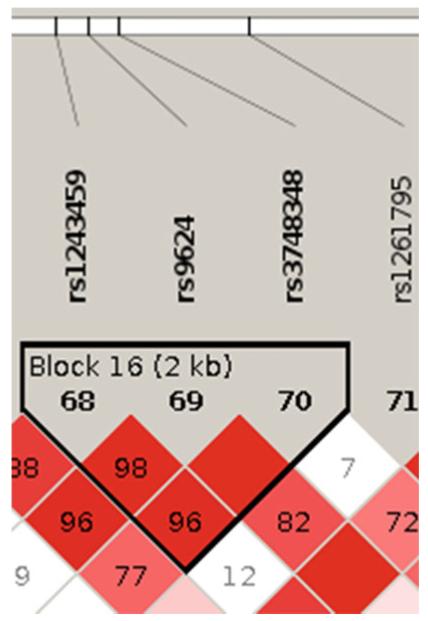
Fig. 4.
The block of interest in the Linkage disequilibrium (LD) plot. Blocks of high LD are outlined as triangles and numbered as indicated in the figure. Shading reflects differences in pairwise LD (whiter r2 = low LD; redder r2 = near-perfect LD). Numbers in diamonds are estimates of pairwise coefficients (D′), expressed in percentages

