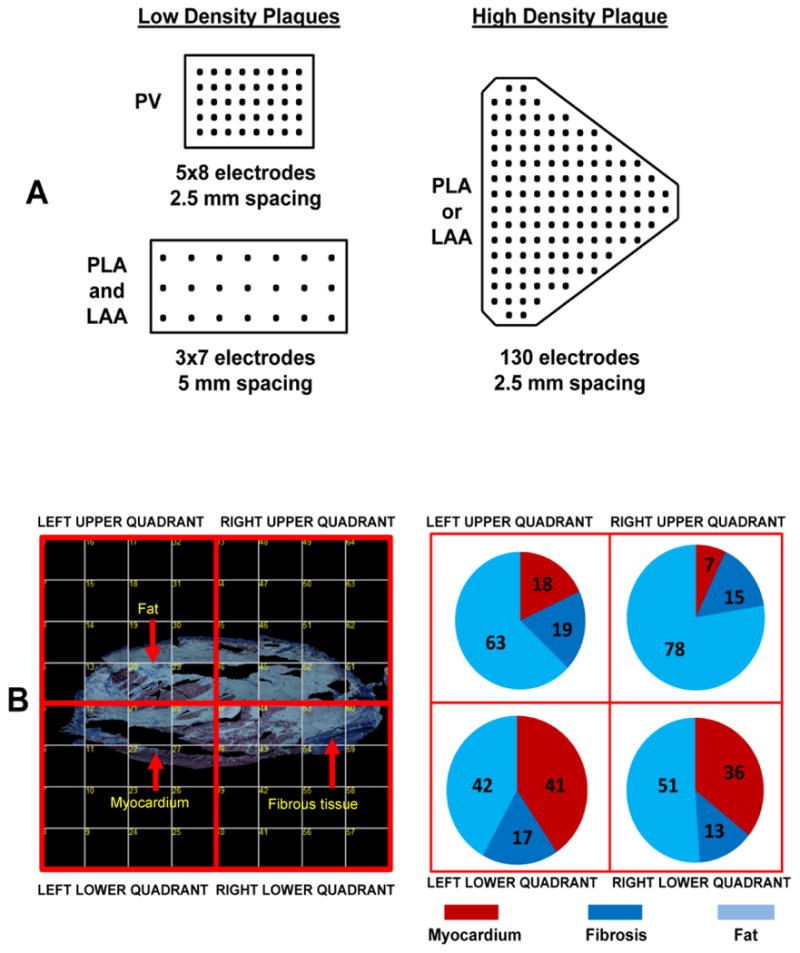
Figure 1.

Panel A shows the density and inter-electrode spacing of the low and high density plaques used for AF-EGM mapping. Panel B shows an entire PLA section on the left, composed of several individual photomicrographs at 4X magnification. The panel demonstrates how the PLA section on the left was divided into four quadrants; for each quadrant, tissue composition i.e. % fat vs. myocardium vs. fibrosis was assessed (see subpanel on the right for tissue composition for each quadrant).
