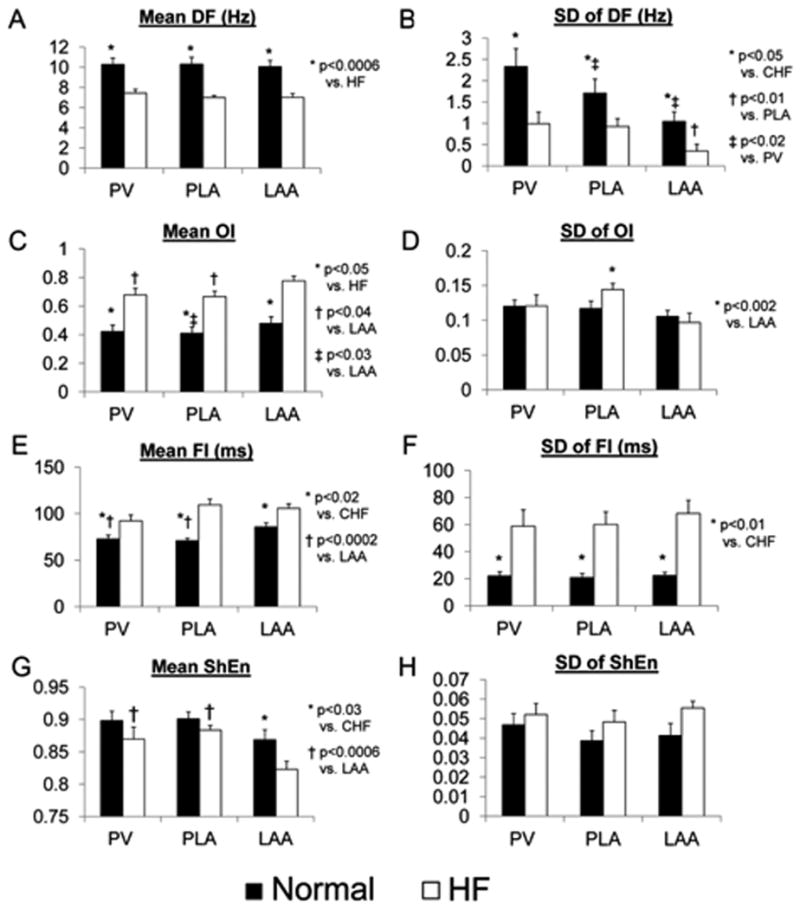
Figure 2.

The figure shows comparisons of DF, OI, FI and ShEn in normal vs. HF atria. Comparisons were made for mean (panels A,C,E,G) and SD (panels B,D,F,H) of each AF measure. Comparisons were made for the PLA, PV and LAA.

The figure shows comparisons of DF, OI, FI and ShEn in normal vs. HF atria. Comparisons were made for mean (panels A,C,E,G) and SD (panels B,D,F,H) of each AF measure. Comparisons were made for the PLA, PV and LAA.