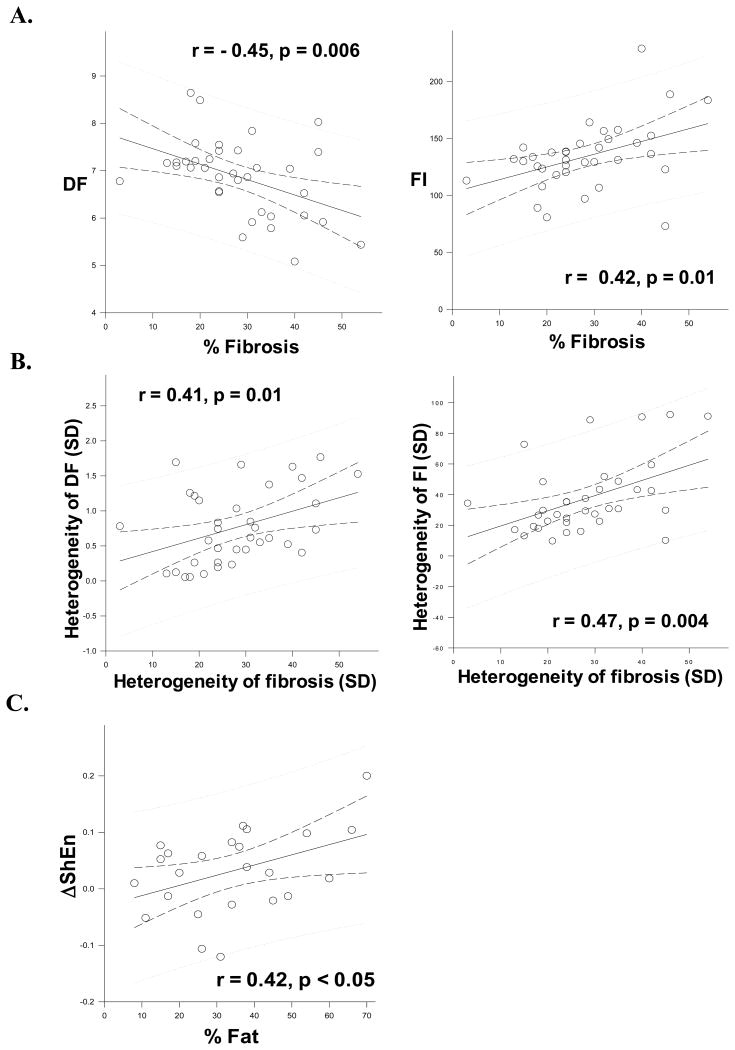
Figure 5.
Panel A, subpanels i and ii shows the correlation between % fibrosis in the PLA and DF and FI respectively. Panel B shows the correlation between heterogeneity of fibrosis and heterogeneity of DF and FI (subpanels i and ii respectively). Panel C shows the correlation between change in ShEn (ΔShEn) with autonomic blockade and % fat in the PLA.

