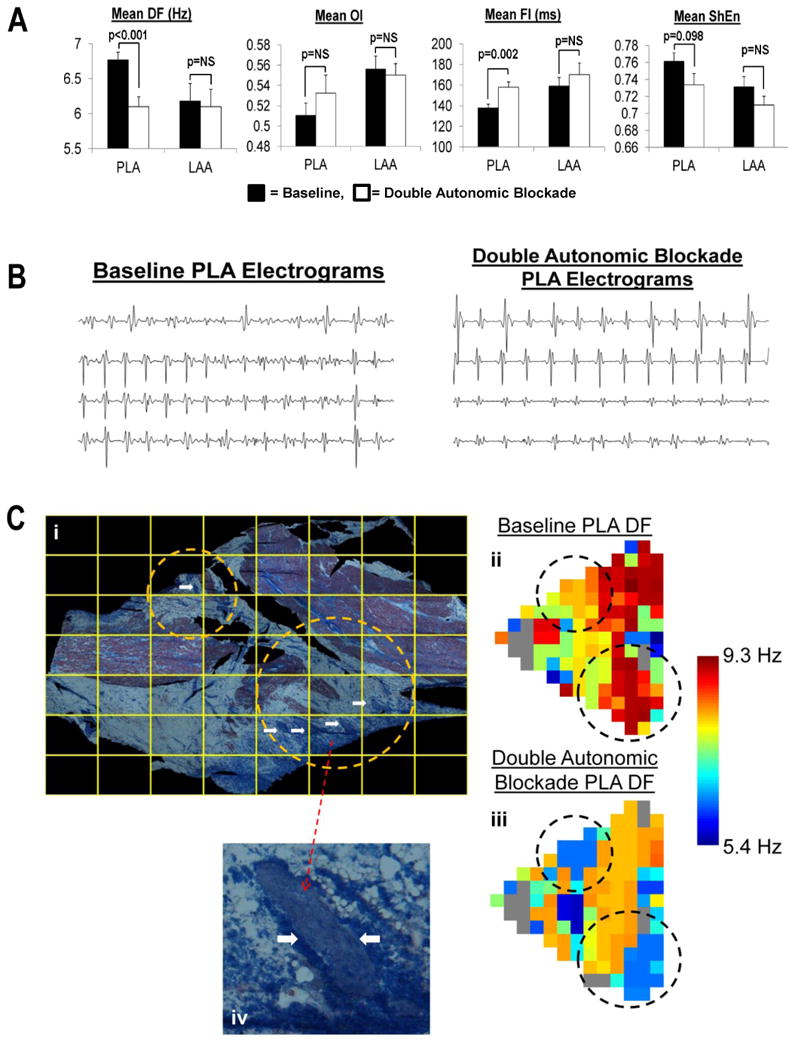
Figure 7.

Panel A shows the effects of autonomic blockade in the PLA and LAA on DF, OI, FI and ShEn. Panel B shows examples of PLA EGMs before and after double autonomic blockade. Subpanel i of Panel C shows the entire PLA section being mapped. The circles highlight areas containing several large nerve trunks indicated by white arrows.Subpanels ii and iii show the DF of an AF episode recorded at baseline and in the presence of double autonomic blockade, respectively. As shown, autonomic blockade resulted in lower DFs in both the upper circle (from roughly 8 to 6 Hz) and in the lower circle (from roughly 9 to 6 Hz). Subpanel iv shows a magnified view of a single nerve trunk seen in the lower encircled area in subpanel i.
