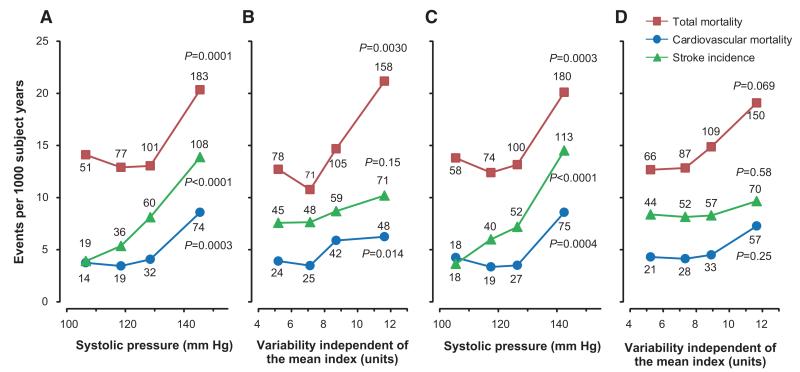
Figure 1.
Incidence of total and cardiovascular mortality and stroke by quartiles of the mean level (A and C) and variability independent of the mean (B and D) of systolic blood pressure measured at home in the morning (A and B) or evening (C and D) in 2421 participants. Rates given as end points per 1000 person-years were standardized for sex and age by the direct method. The number of end points contributing to the rates is presented. The P values refer to the significance for linear trend across the quartiles.

