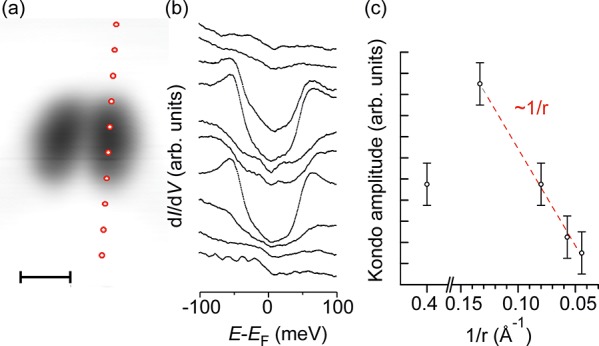
Figure 3.

Decay of the Kondo signal with lateral distance. (a) STM topography of BDPA dimer recorded at +1 V and 50 pA; scale bar = 1 nm. (b) dI/dV Kondo spectra recorded at different tip positions marked by the circles in panel a; the feedback loop has been opened at +1 V, 50 pA, and a z-offset of 70 pm. (c) Decay of the Kondo amplitude with increasing lateral distance, r, from the center of BDPA; dashed line is a fit of 1/r.
