Figure 9.

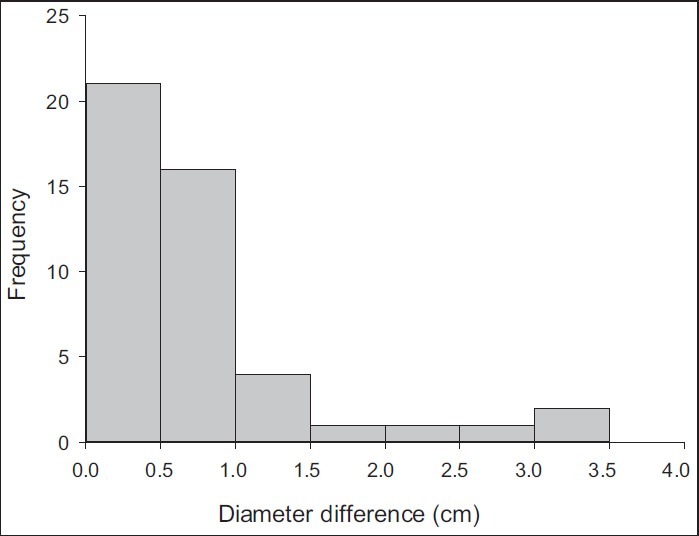
The distribution of discrepancies between patient and contour diameters. Patients’ diameters were checked with caliper and compared to contour data. All patients were treated for T-A-P

The distribution of discrepancies between patient and contour diameters. Patients’ diameters were checked with caliper and compared to contour data. All patients were treated for T-A-P