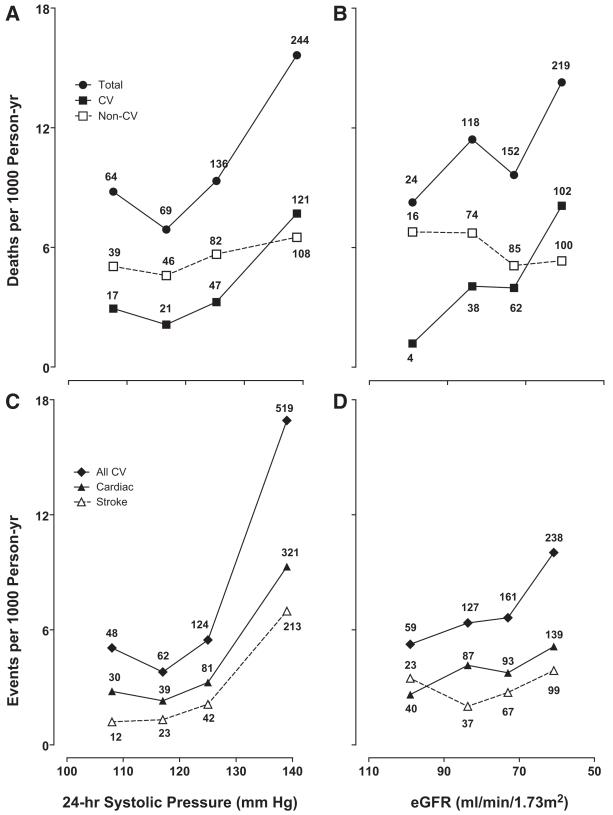
Figure 1.
Incidence of total mortality (A and B) and cardiovascular (CV) events (C and D) across quartiles of the 24-hour systolic blood pressure (A and C) and estimated glomerular filtration rate (eGFR) (B and D). The scale on the horizontal axis is ascending for blood pressure and descending for eGFR. Incidence rates were standardized for center, sex, and age groups (<40, 40-60, and ≥60 years) by the direct method. The number of events contributing to the rates is presented. All P values for trend were significant.

