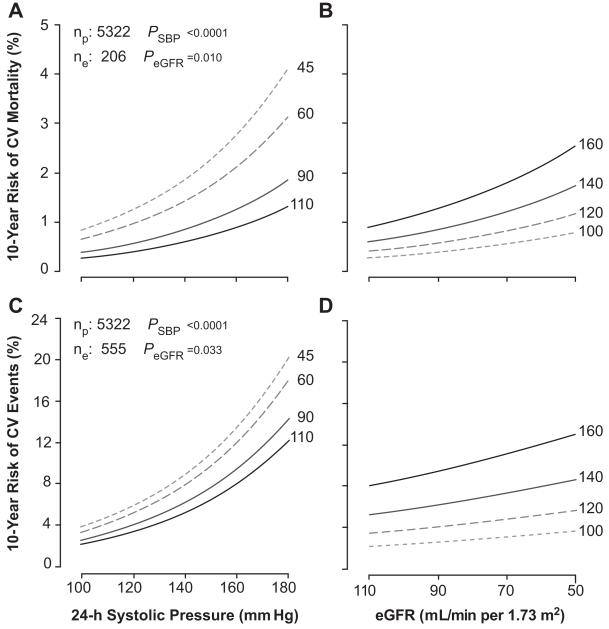
Figure 3.
Ten-year absolute risk of cardiovascular (CV) mortality (A and B) and all cardiovascular end points (C and D) associated with the 24-hour systolic blood pressure (A and C) and estimated glomerular filtration rate (eGFR; B and D). Risk function estimates were standardized to the mean distribution in the whole study population of cohort, sex, age, body mass index, smoking and drinking, serum cholesterol, history of cardiovascular disease, diabetes mellitus, and treatment with antihypertensive drugs. The 24-hour blood pressure is represented by 4 risk functions corresponding with levels of 100, 120, 140, and 160 mm Hg and eGFR by 4 risk functions corresponding with levels of 45, 60, 90, and 110 mL/min per meter squared Plotted values of the eGFR and 24-hour systolic blood pressure span the fifth to 95th percentile interval. P values are for the independent effect of the estimated glomerular filtration rate (PeGFR) and 24-hour blood pressure (PSBP). np and ne indicate the number of participants at risk and the number of events.

