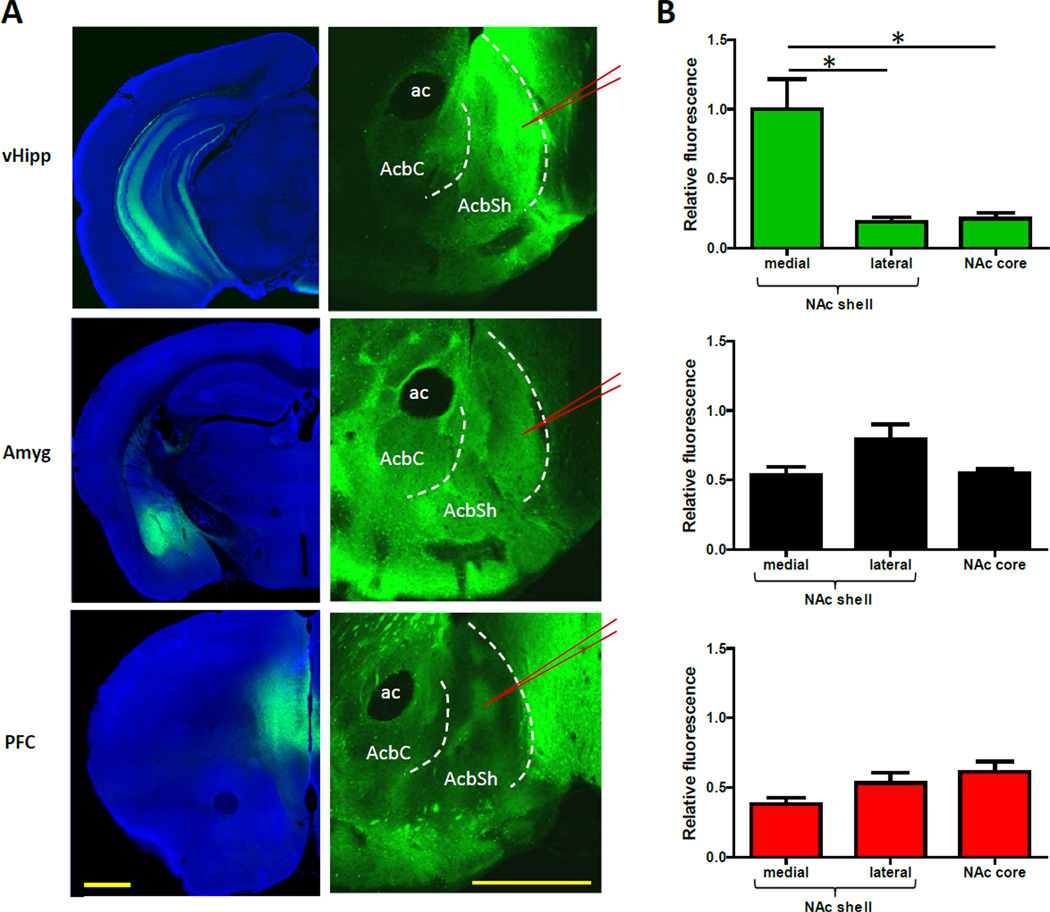
Figure 1. vHipp Input to the NAc Is Uniquely Concentrated in the Medial NAc Shell.
(A) Representative coronal brain slices showing expression of EYFP (green) after virus injection into the vHipp, basolateral amygdala, or prefrontal cortex. See also Figure S1. The left panel shows images from the sites of virus injection. The right panel shows images of EYFP-expressing afferents to the NAc. To enable comparisons, the NAc images were captured and processed using identical settings. The red lines indicate where patch recordings would be obtained from, as described later in the text. (B) The average fluorescent signal in each region of the NAc, relative to the brightest signal, shows vHipp input is uniquely concentrated in the medial NAc shell (n = 6, 4, and 6 for the vHipp, amygdala, and prefrontal cortex pathways, respectively; one-way ANOVA for vHipp input, F(2,15) = 13.0, P < 0.01; post hoc tests of medial shell versus core and lateral shell, P < 0.01 for both; one-way ANOVA for other two pathways, P > 0.05). Images are counterstained with the nuclear dye DAPI (blue). All values are mean + SEM and * indicates p < 0.05. Abbreviations: ac = anterior commissure, AcbC = nucleus accumbens core, AcbSh = nucleus accumbens shell, Amyg = amygdala, vHipp = ventral hippocampus, PFC = prefrontal cortex. Scale bars are 1 mm.

