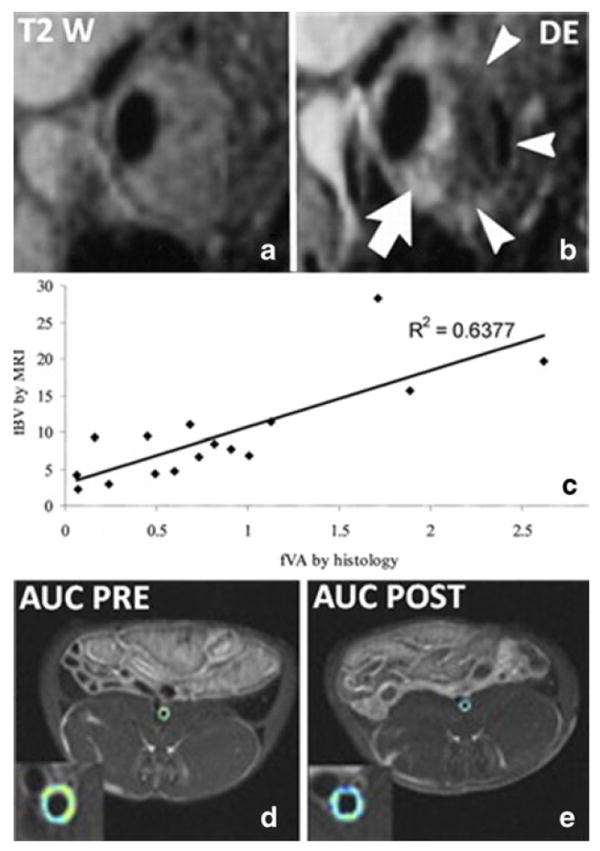
Fig. 2.

Example of application of non-targeted gadolinium based contrast agents. a, T2 weighted image of stenotic human carotid plaque. b, T1 weighted post-contrast image of the same plaque shown in a. The white arrows indicate highly enhancing regions in adventitia and fibrous cap. The dark non-enhancing region is a lipid core, which is not visible without contrast in the T2 weighted image in a. c, correlation between plaque neovascularization by histology and fractional plasma volume calculated by DCE-MRI of carotid atherosclerosis. d and e, area under the curve (AUC) calculated by DCE-MRI in the aorta of a representative atherosclerotic rabbit before (d) and after (e) treatment with pioglitazone. The colder colors of the AUC map in panel e indicate a reduction of neovessels/permeability after treatment. Panel a and b were reprinted with permission from Radiology. 2002 May;223 (2):566-73. Panel c was reprinted with permission from Circulation. 2003 Feb 18;107(6):851–6. Panels d and e were reprinted with permission from JACC Cardiovasc Imaging. 2011 Oct;4(10):1100–9
