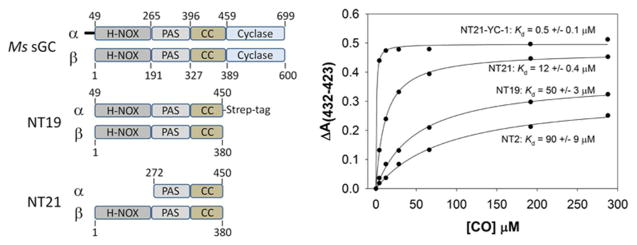
Figure 1.

Ms sGC domain boundaries, expression constructs and equilibrium CO titration measurements. (Left) Shown are the predicted domain boundaries and boundaries for constructs NT19 and NT21. Not shown are constructs NT1 (α1 1–471, β1 1–401), NT2 (α1 49–471, β1 1–401) and NT13 (same as NT19 but without Strep-tag). (Right) Representative saturation binding curves. NT21 responds to YC-1 with a 6-fold tightening of the CO-dissociation constant. Also examined were NT2 + YC-1 (KdCO/YC-1 = 1.0 ± 0.1), NT13 (KdCO = 42 ± 5), NT13 + YC-1 (KdCO/YC-1 = 0.9 ± 0.1), and NT19 + YC-1 (KdCO/YC-1 = 0.8 ± 0.1).
