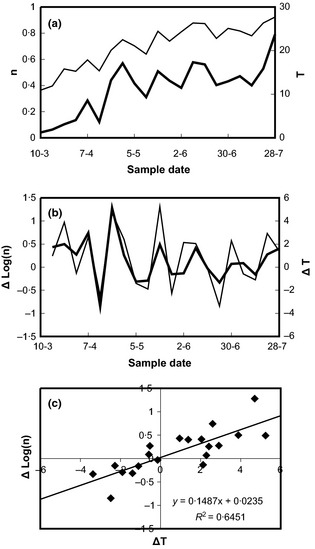
Figure 1.

Relationship of time course of temperature and carabid catch rate (#1, Wageningen, the Netherlands 2004, field 8). Panel (a) shows the time trends of the catch (bold line) and of temperature (thin line). Panel (b) shows the same time series in the form of first differences (logs in the case of the catch). Panel (c) displays a significant regression of the difference in the log of the catch on the difference in temperature.
