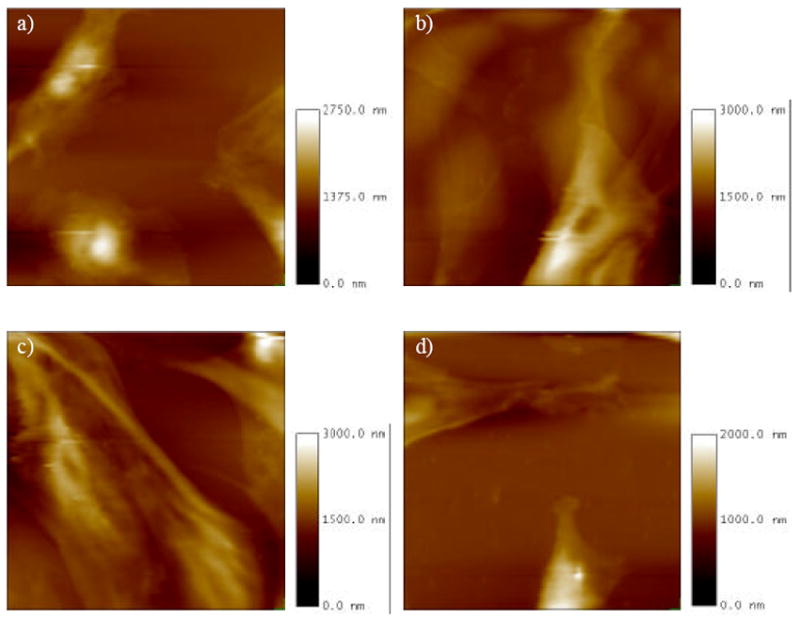
Figure 2.

Height image portion of the force-volume image for MC3T3-E1 osteoblastic cells grown on plasma cleaned glass (a), flat polystyrene (b), 11 nm nanoislands (c) and 38 nm nanoislands (d). All images are 120 μm × 120 μm with different z axis maximum (see scale bars).
