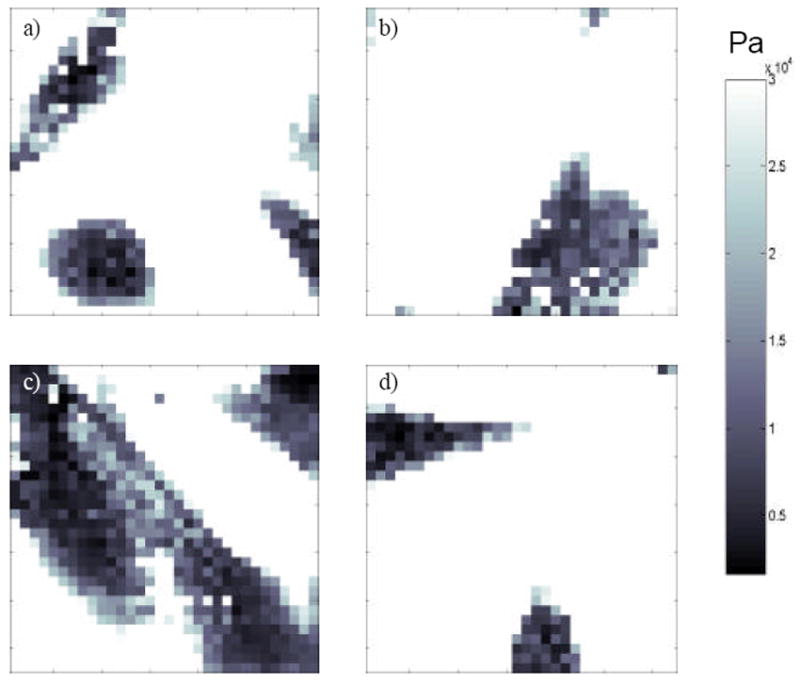
Figure 3.

Quantitative elastic modulus map constructed from the same experiment as the height images shown in Figure 2, with plasma cleaned glass (a), flat polystyrene (b), 11 nm nanoislands (c) and 38 nm nanoislands (d). White pixels are those where the elastic modulus was over the threshold value of 30 kPa. Darker areas are regions with lower modulus values indicated by the scale bar that has a maximum value of 30 kPa.
