Figure 4.

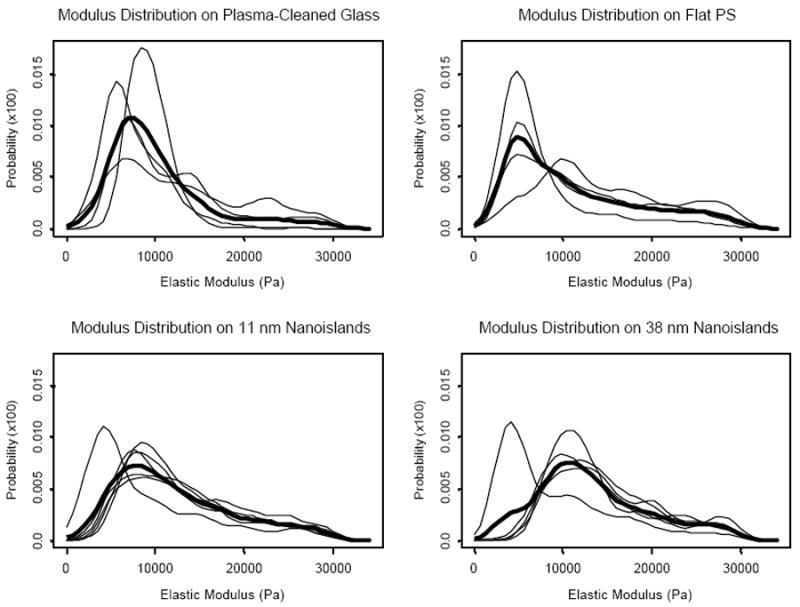
Probability density functions of MC3T3-E1 cell modulus for each indentation experiment (thin lines) and overall density function (bold line) calculated as an arithmetic mean of the densities at each distinct point (the x-axis of the plot).

Probability density functions of MC3T3-E1 cell modulus for each indentation experiment (thin lines) and overall density function (bold line) calculated as an arithmetic mean of the densities at each distinct point (the x-axis of the plot).