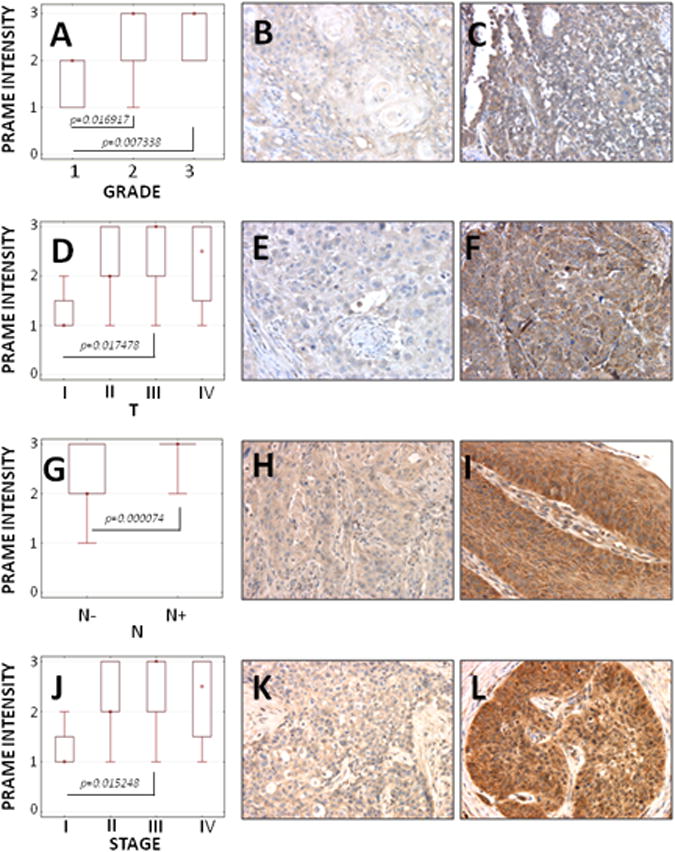
Figure 3. PRAME expression in HNSCC tissues.

(A) PRAME staining intensity vs. tumor grade in all tumors; (B, C) representative PRAME expression in G1 tumor vs. G3 tumor (× 200); (D) PRAME staining intensity vs. tumor size for all tumors; (E, F) representative PRAME expression in T1 tumor vs. T3 tumor (× 200); (G) PRAME staining intensity vs. nodal involvement for N- or N+ specimens; (H, I) representative PRAME expression in tumor without nodal involvement (N-) vs. tumor with nodal involvement (N+) (× 200); (J) PRAME staining intensity vs. clinical stage for all tumors; (K, L) representative PRAME expression in stage I vs. stage III (× 200).
