
Fig. 2.
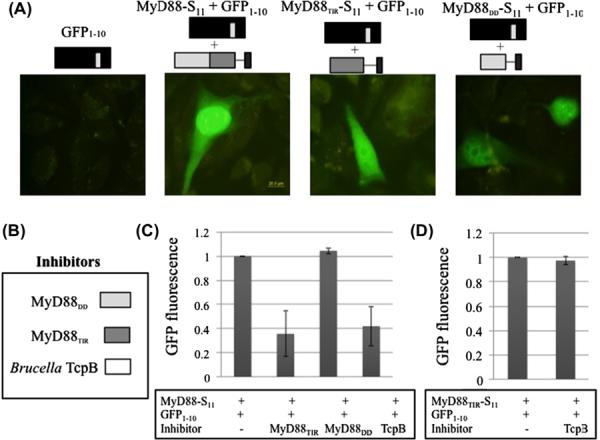
Expression and folding of MyD88 and its domains. (A) CHO cells were singly or co-transfected with GFP1–10, and MyD88-S11, MyD88TIR-S11 or MyD88DD-S11, as indicated. Fluorescence micrographs of cells were visualized using FITC channel excitation at 488 nm and emission at 515 nm filters with 100× magnification. Scale bar is 20 μm. (B, C) CHO cells were transfected in triplicate with MyD88-S11 and GFP1–10, with and without MyD88TIR, MyD88DD and TcpB. GFP fluorescence was quantified as indicated in materials and methods. (D) CHO cells were transfected with MyD88TIR-S11 and GFP1–10, with and without TcpB. Mean GFP fluorescence + the standard deviation from three experiments is indicated.