
Fig. 4.
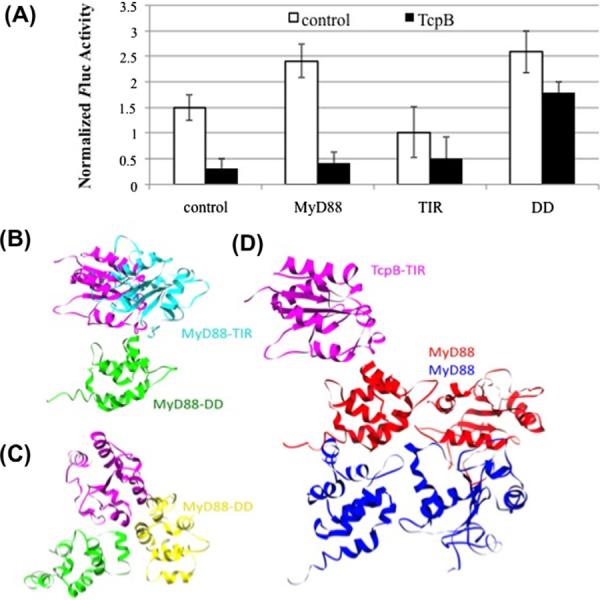
NF-κB response and model of TcpB interaction with MyD88. (A) GloResponse NF-κB RE-luc2PHEK293 cells were singly- or co-transfected with MyD88, MyD88DD or MyD88TIR, and TcpB as indicated. Luminescence measurements from cells were normalized to cell titer. Cells mock-transfected or singly-transfected with MyD88TIR, MyD88DD and MyD88 are indicated as controls. Means and standard deviations from a representative of three experiments performed in triplicate are shown. (B, C) Model for the binding of TcpB to MyD88DD and full length MyD88. The binding of TcpB to MyD88DD prevents the formation of a MyD88 DD–TIR domain heterodimer. TcpBTIR is shown in magenta, MyD88TIR is shown in cyan, MyD88DD is shown in green and yellow. (D) Model for the interaction of the TcpB TIR domain with a MyD88 homodimer. TcpBTIR is shown in magenta, and the two MyD88 molecules in the homodimer are shown in red and blue. (For interpretation of the references to color in this figure legend, the reader is referred to the web version of this paper.)