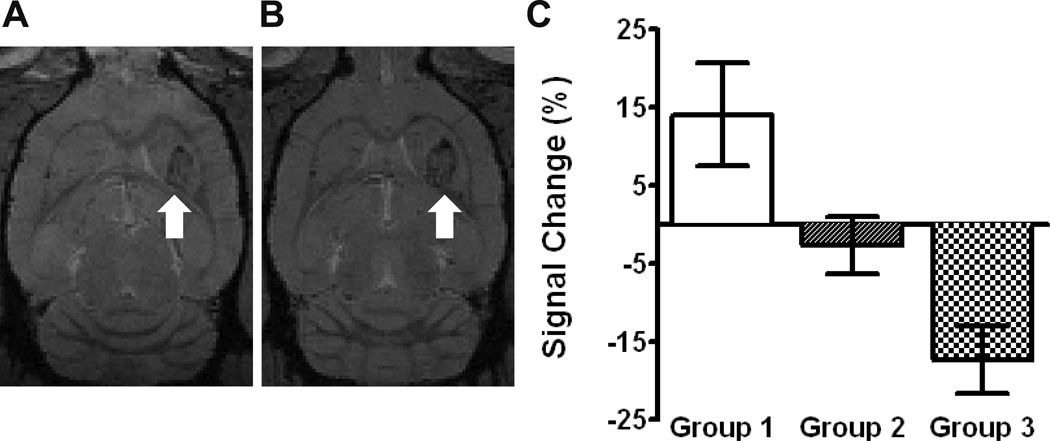
Figure 4.
HER2-specific NK-92 cell detection with 7T MRI. A baseline axial T2*-weighted MR image from group 3 is shown with the tumor identified in the left frontal striatum (white arrow), A. The corresponding post-treatment image demonstrates a signal reduction at the tumor site (white arrow), B. C shows the average signal intensity change (mean ± SEM) at the tumor site following treatment. A negative change suggests the accumulation of iron-labelled effector cells. There was a statistically significant difference between group 3 and group 1.

