. 2012 Aug 13;39(2):338–347. doi: 10.1037/a0029717

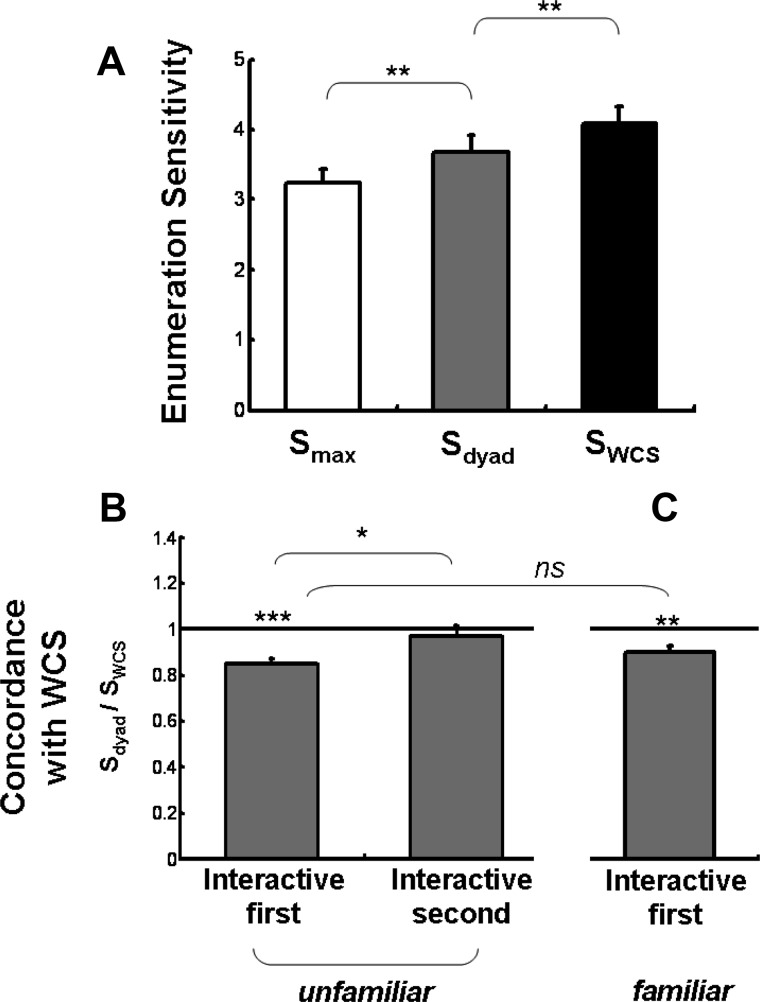
Figure 3. The results of collective enumeration. (A) Average enumeration sensitivity (the slope of the psychometric function) is plotted for the best members of the dyads (white), as well as for the dyads (gray) and the corresponding sensitivity expected by the WCS model (black). Error bars = 1 SE. (B) Concordance with the WCS model is plotted for dyads who took the interactive session first (see Figure 1C) versus those who took the non-interactive session first. Horizontal line indicates agreement with the model. Values below the line indicate that the empirical performance was inferior to model prediction. ** p < .01. Error bars = 1 SE. (C) Familiarity control experiment: conventions are the same as panel B but the members of each dyad were familiar with one another.

Figure 3