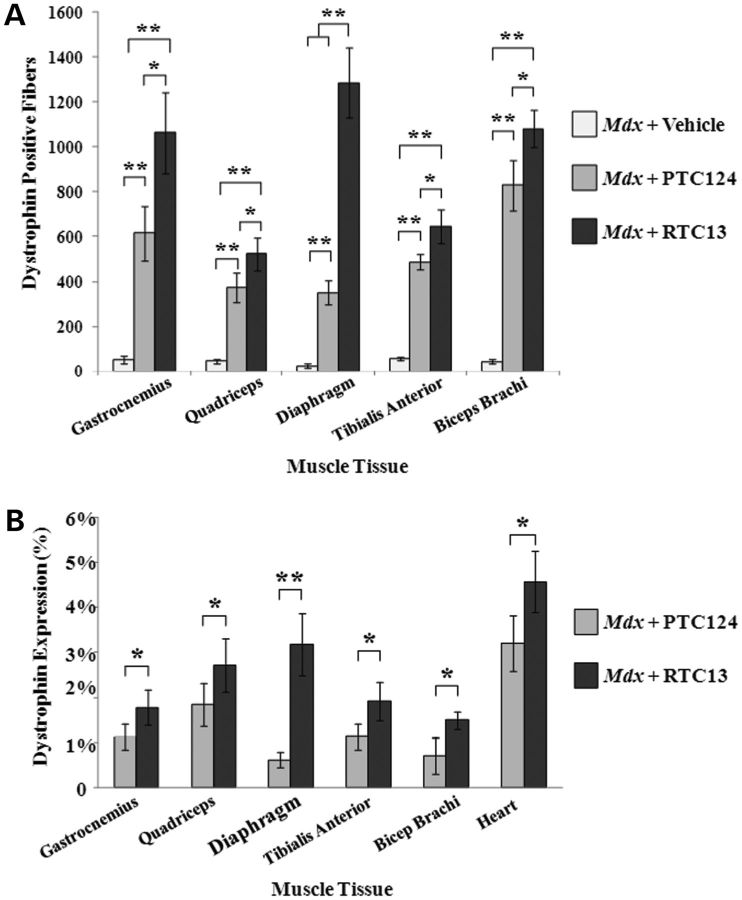
Figure 5.
Quantitative analysis of dystrophin expression after systemic administration. (A) Average number of dystrophin-positive fibers per cross-sectional area containing the highest number of positives. Dystrophin-positive fibers were detected throughout the entire length of the muscle being examined. Muscles injected with RTC13 consistently showed a significantly higher number of dystrophin-positive fibers than muscles of mice that received PTC124 (N = 4 mice per treatment group; *P ≤ 0.05, **P ≤ 0.004). (B) Dystrophin expression was consistently higher in muscles of mdx mice that received RTC13 when compared with those treated with PTC124. Protein was prominent in quadriceps, diaphragm, gastrocnemius and heart muscles of RTC13-injected mice. No dystrophin expression was detected in muscle groups isolated from mdx mice that received vehicle alone. Results were consistent among triplicate experiments (*P ≤ 0.05, **P = 0.001).

