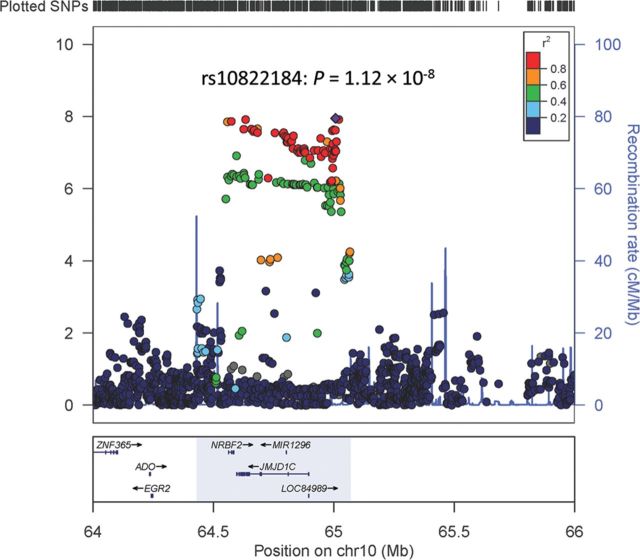
Figure 2.
Regional plot of the associations between SNPs at 10q21 and serum testosterone levels. Association of individual SNP is plotted as −log10 P against the chromosomal position. Results of both genotyped and imputed SNPs are shown. Colors indicate the LD strength between the most significant SNP rs10822184 and the other SNPs assessed. The right Y-axis shows the recombination rate estimated from the 1000 Genomes CEU population.

