Figure 5.
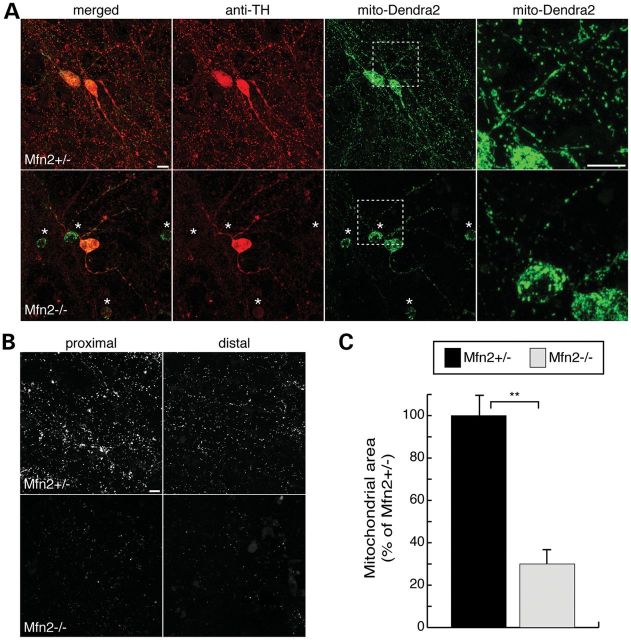
Mitochondrial fragmentation and depletion in slice cultures of Mfn2 mutants. Cre-mediated expression of mito-Dendra2 labels dopaminergic neurons. (A) Slice cultures of heterozygous controls and Mfn2 mutants. Slices were immunostained with TH (red). The first column shows a merged image of TH and mito-Dendra2 fluorescence (green), while the last column is an enlargement of the boxed zone. The asterisks highlight degenerating Mfn2-null neurons that have diminished or absent TH staining. (B) Mito-Dendra2 signal in neuronal projections. Marked depletion of mitochondria in both proximal and distal processes is evident in Mfn2 mutant slices. (C) Quantification of mitochondrial mass normalized to the number of dopaminergic neurons. For each sample, the total mito-Dendra2-positive area in a 5 mm × 5 mm region was measured and normalized to the number of Dendra2-positive neurons. Mitochondrial mass is reported as the percentage area of heterozygous control ± SEM. The Student's t-test was used to evaluate statistical significance (**P < 0.001; n = 5 for mutant slices; n = 7 for control). Scale bar is 10 μm for all images.

