Figure 6.
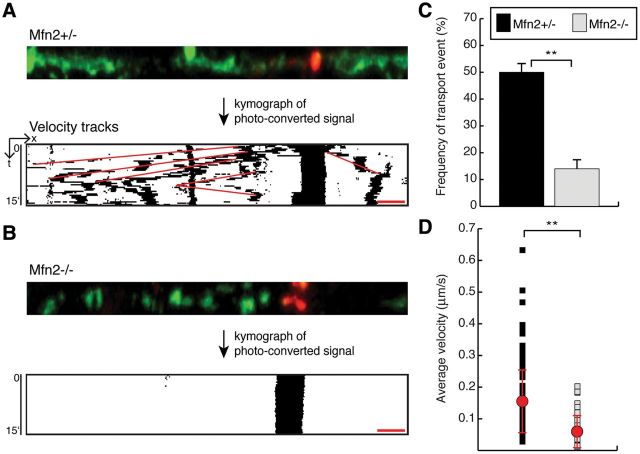
Decreased mitochondrial transport in Mfn2 mutant cultures. (A) A representative tracking experiment of an Mfn2 heterozygous control. A subset of mitochondria in the nerve process was photo-converted to red for time-lapse imaging. The images of the photo-converted signal were processed into a kymograph to visualize mitochondrial movement (binary image). Velocity measurements were calculated from the red tracks that overlay mitochondrial trajectories. (B) Representative tracking experiment in an Mfn2 mutant showing the loss of mitochondrial transport. (C) Quantification of mitochondrial transport in neuronal processes. For each photo-conversion experiment, a positive event was defined as the directed movement of more than 5 μm during the 15 min recording session. The graph shows the frequency of photo-conversion experiments that resulted in at least one positive event. For Mfn2 heterozygous slices, 150 experiments were scored; for Mfn2 mutant slices, 138 experiments were scored. The Student's t-test was used to calculate statistical significance (**P < 0.001). (D) A scatter plot of the average velocity of moving mitochondria. The red dots indicate the population averages ± SD. Statistical significance was calculated as in (C) (n = 138 mitochondria in heterozygous slices, n = 38 mitochondria in mutant slices). Scale bar is 5 μm for all images.

