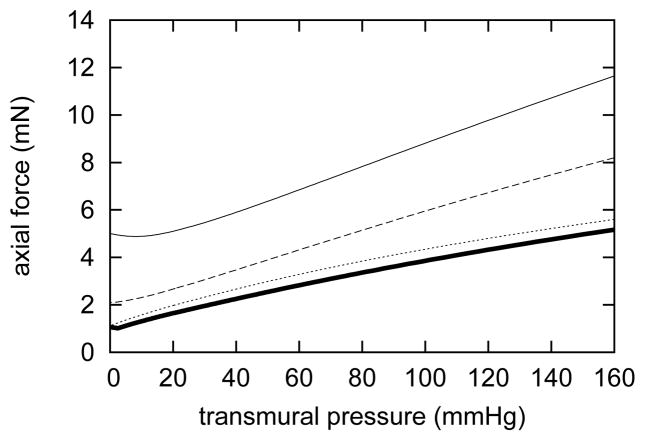
Figure 5.
Evolving passive axial “force-pressure” responses due to G&R for a 5% step increase in in vivo axial extension at days 0 (solid), 14 (dashed), and 1000 (dotted). The original “force-pressure” response is indicated by the solid bold curve. Response curves shifted down as the artery remodeled around its new axial length [cf. 9]. Note that by 1000 days, the passive response nearly equaled the original response, indicating a near complete recovery of the artery’s original axial “force-pressure” behavior at the new in vivo axial length.

