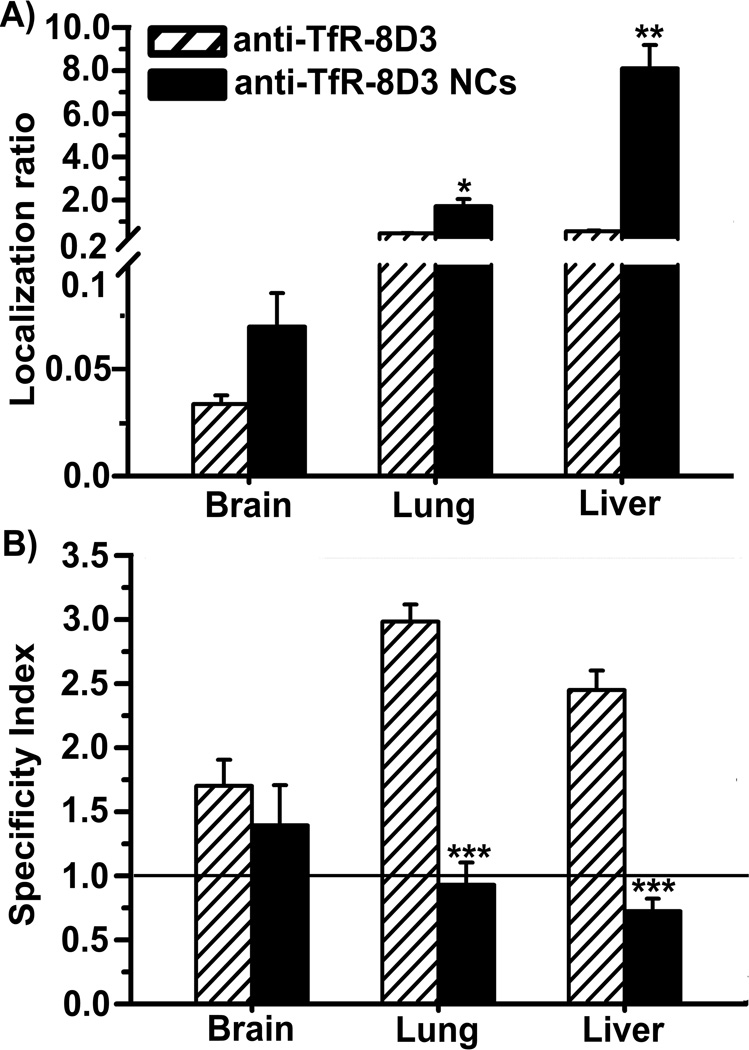
Figure 2.
Biodistribution of free anti-TfR-8D3 vs. nanocarriers coated with anti-TfR-8D3. Localization ratio (LR) and specificity index (SI) of brain, lungs, and liver are shown in (A) and (B), respectively. Data are mean ± S.E.M. (n ≥ 3 mice).* p < 0.05; ** p < 0.01; *** p < 0.001, comparing anti-TfR-8D3 to anti-TfR-8D3 NCs, by Student’s t-test. NCs = nanocarriers.

