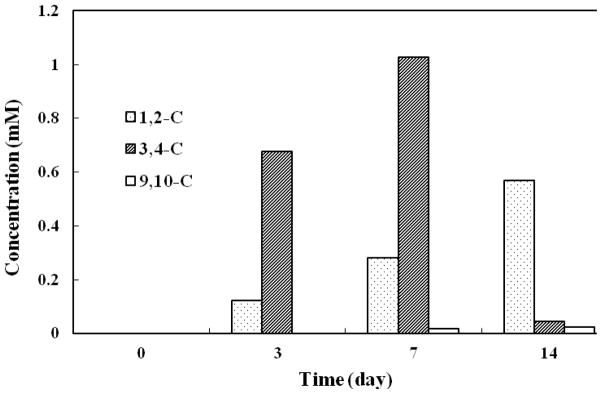
Fig. 4.

Concentration profiles of metabolites in upper metabolic pathways. 1,2-C, 3,4-C, and 9,10-C denote the metabolites from the dioxygenations on corresponding positions and subsequent metabolism. Metabolites included for the concentration calculation were P1, P4, P9 and P11 for 1,2-dioxygenation; P2, P5, P6, P7, P12 and P13 for 3,4-dioxygenation; and P3 and P8 for 9,10-dioxygenation.
